Summary
This whitepaper reviews an approach for applying machine learning and predictive analytics in a B2B sales & marketing environment.
Take Our Content to Go
If you were to search news articles for B2B sales or marketing analytics using your favorite search tool, you would likely find a number of articles stating how B2B marketing is antiquated, or how far behind B2B marketing is from B2C. One cannot be sure if this is just conjecture to drum up business for marketing agencies or consulting firms, but there does seem to be quite a few people writing about it. An area many companies can go after is data analytics. It might require partnering with a machine learning consulting firm, but if you aren’t leveraging analytics, your competition is.
Here at Mosaic, a leading machine learning consulting firm, we don’t believe that is the case. In the following white paper, we will lay out a scientific approach to utilizing predictive analytics and machine learning using our own sales data. B2B firms might not have the wealth of transactional data B2C firms have, but they still have data and should take advantage of it to improve their sales processes, spending less to win more.
B2B Machine Learning Introduction
Where to Start
To begin a machine learning analysis, we need two things:
- A question or hypothesis to test
- A metric or group of metrics on which the results will be evaluated
The question usually takes the form of: Can I predict with x level of accuracy if a sales opportunity will be a win or a loss? The metric can be anything specific and measurable, such as the probability that a deal will close, or effects on Costs of Goods Sold (COGS), Customer Acquisition Costs (CAC) or Customer Lifetime Value (CLV). Let’s go through an example on predicting wins and losses.
I have two sales opportunities I am tracking and need to decide which one is worth scheduling a follow up call with a member of the project delivery team. In this scenario, I assume overhead budgets only permit a technical representative to attend one call. In a perfect world, I would like to follow up on both opportunities with one of our engineers or analysts, but how can I prioritize one over the other given the overhead restrictions?
Our question could be: Does Opportunity A lead to a higher likelihood of a win than Opportunity B? Our metric in this case will be the probability of closing a deal. To get an idea of how we can analyze the results, let’s consider some round numbers. Suppose Opportunity A is a project worth about $50,000 and our potential client is an Oil & Gas company, while Opportunity B is worth about $250,000 and our potential client is a Retail Firm, as shown below:
| Opportunity | Price | Industry |
| A | $50K | O&G |
| B | $250K | Retail |
Figure 1 – SQL Score for Mosaic Data Science Sales Process
As a typical sales rep, I would probably look at those numbers and automatically select Opportunity B. Why? Of course, because I see dollar signs that represent a larger potential revenue for my company. Many B2B sales processes move forward with Opportunity B based on this ‘gut’ decision. However, without further analysis, how can they be sure that they aren’t investing in an opportunity that is significantly less likely to close and forgoing an easy win? Making the wrong ‘gut’ decision can inflate your COGS and have other negative consequences downstream.
B2B sales and marketing departments could achieve better results by considering other variables that differentiate sales opportunities beyond the dollar signs, such as industry, sales cycle time, time of year, point of contact information, etc. to predict how likely a sales opportunity is to close.
Next, we will act as if we are a savvy sales department, investigating these two opportunities further to determine which to pursue. Many firms require the expertise of machine learning consulting firms to help identify analytics opportunities. To carry out our analysis, we will utilize the Define Measure Analyze Improve and Control framework, also known as DMAIC.
Define
In the define phase, we will lay out our hypothesis, success criteria, goals, and analysis plan. Further, we will clearly communicate these activities to key stakeholders and will frequently refer back to our definitions throughout the project.
For this Mosaic B2B machine learning paper, we had noticed a rise in our COGS metric and wanted to combat this rise using some of the data analysis techniques our data scientists frequently use to help our clients. We wanted to create a predictive model to provide probabilities of win for active sales opportunities in our funnel. Success would be measured by an accuracy metric from the model, as well as a COGS decrease, CAC decrease, and CLV increase. Like most businesses, our COGS value is a key factor in calculating our CAC and CLV metrics.
As part of the hypothesis step within the define phase, we had some guesses and questions we wanted to answer from our data. We cannot stress how important this step is because boiling the ocean to get a few key nuggets is not advisable when building predictive or machine learning models. Starting with the end in mind will help focus the machine learning consulting team so they will be more efficient and deliver the most value.
Measure
In the measure phase of the project, we wanted to treat our sales process like any other business process, and a great way to measure a process’s relative success or shortcomings is using a Sigma Quality Level (SQL) score. In short, SQL scores quantify how efficient your process is. Though SQLs are used extensively in manufacturing and with Six Sigma practitioners, with the right amount of definition, this metric can be applied to other businesses, such as B2B firms in a variety of industries. SQL equation listed below:
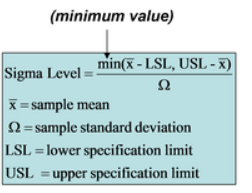
In Mosaic’s sales department, we rank sales opportunities using a scale of 1–7 as part of our qualification step. To enable generation of SQL scoring, we set a threshold within this scale to mark certain scores as defects. Figure 1 shows the calculation and the SQL score our sales process generated.
| Defect opportunities per unit: D = | 6 |
| Units produced per time frame: U= | 678 |
| Units produced per time frame: U= | 4068 |
| Total actual defects in timeframe: A = | 297 |
| Defect-per-opportunity rate: A / DU = DPO = | 0.0730088 |
| Defects per million opportunities (DPMO): DPO × 1,000,000 = | 73,009 |
| SQL Value (from SQL table) = | 2.9 |
This SQL score measures the number of standard deviations (defects) from your mean (sales opportunities). A higher SQL score means that a significant part of the tail of the distribution extends past the specification limit. The lower the score, the fewer the defects. All in all, we thought there was significant room to improve from a score of 2.9, even though a ‘quality’ process is typically defined as 3.4 defects per million opportunities.
Another key phase of this process is to identify and implement a solid data collection plan to meet your goals, as identified in the Define phase. For this project, most of the data resides in our Customer Relationship Management tool, making it easily accessible at any time. With the rise in use of these tools, many B2B firms have access to similar internal data, and sometimes further collaboration with a machine learning consulting firm is needed.
Analyze
The analysis phase is probably the most exciting because it can uncover insights about your internal process and answer key business questions that could affect day-to-day operations. This phase should take a good chunk of time as data scientists try out different statistical and machine learning approaches, and iterate with the sales team and company leadership on results, ultimately finding an effective, powerful approach. If working with a machine learning consulting firm, you should iterate through different analysis results to identify areas that are most important your business and to keep machine learning consulting representative focused on applicable outcomes.
Exploratory Data Analysis and Data Mining
Undertaking exploratory data analysis and data mining during the analysis phase is crucial for B2B machine learning.
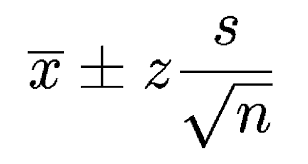
An exploratory data analysis is a useful first step that should yield interesting results to help answer key questions about your sales processes. In our case, the sales and company leadership had expressed interest in understanding certain things a descriptive analytics approach could find. First, we wanted to know with a 95% confidence interval what the duration of our average sales cycle was, from opportunity creation to close. Second, we wanted to know with a 95% confidence interval what our average contract value was. Using descriptive statistics and exploratory data analysis techniques, we were able to uncover that 95% of our sales opportunities fall between a certain number of days and average contract values, between a certain deal price. While these ranges could be considered large, we were able to immediately take steps to allocate more resources to potential deals that fell within the ranges we found and fewer resources to potential deals outside those bounds.
To validate these statistical insights, we used a two sample long tail hypothesis test, as shown in Figure 2. With these distribution tests, the Ho is the null hypothesis and the Ha is the alternative hypothesis. In order to prove statistical significance, you need to prove the null hypothesis to be false. In both cases, the Ho value proved to be lower than Ha, validating our lower and upper confidence bands.
These descriptive statistics were useful to make some initial process changes, but they certainly did not provide any predictive insights. We needed to test a number of different modeling approaches during the data mining step. After running a preliminary data assessment to look for missing values, collinearity (which can dilute model results), and outliers, we decided to start training different statistical and machine learning models on the data. We felt a classification model would give us useful results since the y (dependent) variable was a binomial, as in yes = deal closed as a win or no = deal closed as a loss.
During the data mining phase, substantial feature engineering was conducted on the training data to make sure the data made sense, and we were incorporating enough variables to create a model that could deliver actionable results instead of chasing a great R squared or accuracy score.
When evaluating predictive model for accuracy it is important to measure the R squared number. In short, the R Squared is a statistical measure of how close the data are to the fitted regression line, or in other words, how well your model explains the variability of the response data (your x) to your dependent variable (your y). There are multiple ways to test for these scores, and the McFadden, Cox and Snell and Nagelkerke scores are widely used. Any good machine learning consulting firm should be well versed in these techniques and accuracy tests. After testing multiple approaches, including binomial logistic regression (logit), support vector machine, and random forest and comparing the R squared scores, the logit model performed the best, as shown in Figure 3.
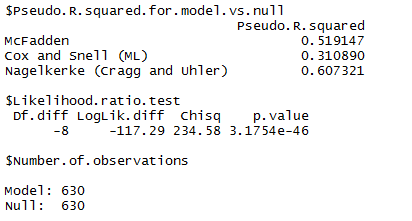
This logit also produced the highest accuracy metric during validation, predicting a sales opportunity to turn into a win, at 89.05%.
Through this analysis, we proved some hypotheses and were surprised by some of the predictive analytics results. First, it should come as no surprise that existing business deals were found to be more likely to close than new business deals, as shown in Figure 4.
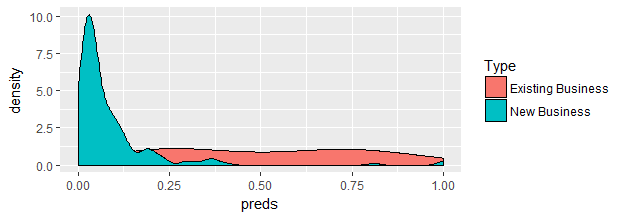
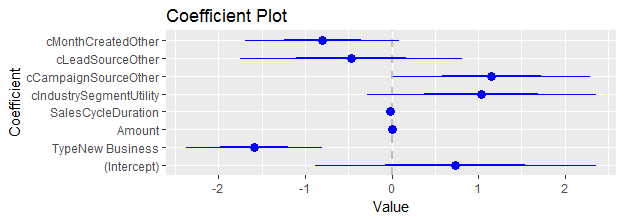
Figure 5 depicts the coefficient plot and gives sales leaders some insights into what variables matter when it comes to a win versus a loss.
Improve
Now that we can predict within 89% accuracy of what our sales pipeline should be doing, we decided to shift our focus to macro-level events such as forecasting the number of wins, number of opportunities, contract value, and number of proposals delivered each month. When partnering with a machine learning consulting company, you need to keep them focused on synthesizing analytics to business outcomes.
This required us to format our data as a time series; we chose monthly counts because they made the most sense for our reporting purposes. A number of different forecasting methods were tested, including ARIMA, ARIMAX, Exponential Smoothing, AR1, and Moving Average. Not surprisingly, since we are a business that is growing rapidly, an exponential smoothing forecast with a dampening factor to focus on the last couple of months’ results produced the most accurate forecasts after validation. With these forecasts, we can begin to better track and gauge our progress on a monthly basis and make adjustments if we are falling short on our numbers or make contingency staffing plans or alert our HR recruiter if we are beginning to consistently exceed our forecasts. Machine learning consulting companies are quite adept at innovating traditional time series forecasting techniques.

Control
At this point in our analysis, we have developed a model that predicts opportunities that are more or less likely to move forward as a win, as well as a monthly forecasting model that predicts opportunities, wins, contract values, and number of proposal submissions. This is really useful information in helping our sales department plan for future business. The control phase of the DMAIC process is often overlooked, yet it is the phase that evaluates the value of the modeling undertaken and makes sure your sales process isn’t jumping out of control. If you are working with a machine learning consulting company, you need to identify success criteria early on in the project. In the control phase, we will measure how the tools we built and process changes they spurred have affected our COGS, CAC, and CLV metrics.
In a quarter period of testing after model implementation we saw:
- COGS: 45% decrease. We are spending fewer resources pursuing deals that are likely to be lost.
- CAC: 54% decease. The logit model steered us to use more effective ad channels.
- CLV: 38% increase. We spend more time with customers, increasing the value of our contracts with them.
- SQL: .7 point decrease. Our sales process now produces fewer defects, showing more efficiency.
Conclusion
This paper only scratches the surface of what is possible, and we didn’t fully disclose all of the things learned from this project! Hopefully this paper was enough to prove to that B2B-focused firms can take advantage of their data, applying predictive analytics, and improving their sales processes and overall health of their company. By partnering with a machine learning consulting company, B2B machine learning is possible!


