Summary
Mosaic delves into how businesses can integrate weather effects in their decision making.

Take Our Content to Go
Intro
The true power of any Machine Learning driven system often comes its ability to integrate real-time data sources to allow for dynamic decision-making in response to changing conditions. This is in fact the basis for many Artificial Intelligence applications. Once businesses processes are viewable in a digital environment, layering on additional features has huge incremental value. For example, if a delivery route management system was aware of internal inventory constraints, current traffic, and upcoming disruptive weather, scheduled delivery routes could be adjusted to maintain efficiency.
Weather has a high impact on operations in many industries, and therefore is of great value to integrate into strategic decision making. Mosaic Data Science, a top machine learning consulting company, has roots in aviation research & development, giving us deep expertise in combining weather data streams with planning applications to facilitate efficient resource allocation.
What do we mean by “weather data?”
Weather data includes sensor-based measurements of surface temperature, pressure, wind and precipitation. It also includes forecasts generated by one of several sophisticated models. These models range in the way forecasts and measurements are linked to locations. For example, one common data source published by the U.S. National Weather Service uses measurements collected at specific weather stations across the United States to create forecasts for future weather at those exact point locations. Another common data source does not use point locations at all; rather, a two-mile square grid is overlaid onto the entire continental U.S., and a variety of inputs are used to generate forecasts for each grid cell. Weather data can also include relatively consistent atmospheric patterns such as jet streams, as well as more transient events such as tropical storms.
The rise of services such as Weather Underground, an open source database built by enthusiasts who place sensors in their place of residence, provide machine learning engineers with even more sources to turn to.
Challenges in Using Weather Data
With the availability of multiple weather sources, it seems only natural that businesses can just download these sources, merge with preexisting data and presto, you understand how weather impacts your business! For those who have dealt with weather data, you know this is not the case.
Weather is inherently linked to geography – the question “how’s the weather?” only makes sense in the context of “where” the weather is occurring. Indeed, due to the geographic nature of weather data sources, they are ideal for integration into machine learning applications.
The main challenges, however, in using weather data for machine learning technology are the scale of the data and the interpretation of the information. If one imagines weather data being measured or forecast hourly for hundreds of thousands of locations around the globe, storing and using this data on the fly could be difficult. Sure, it may be possible to store and dynamically display real-time weather for a single city or region. But in a global business climate, it is the ability to simultaneously track the situation on the ground in many locations that drives value.
In addition to scale, weather information is not always interpretable in its original format. Some data sources are from deterministic models that predict, for example, that it either will or will not rain today in Washington, D.C. based on current storm locations. Other models are probabilistic – they might report that there’s a 30% chance that a storm will pass directly over Washington, D.C. and drop several inches of rain, but there’s also a 70% chance that the storm will head north instead towards Baltimore, MD. Subject matter expertise is often required to synthesize predictions from these different types of data sources to fit a specific business’s needs.
Integrating Weather into Machine Learning Insights
Mosaic has been working with weather data for decades through partnerships with the U.S. government, commercial airlines and a diverse set of commercial customers. Mosaic’s machine learning consultants are skilled at transforming weather data for different use cases and in efficiently storing this information in scalable cloud-based systems.
In addition, Mosaic archives historical weather forecast data from multiple sources to enable efficient development and testing of custom machine learning solutions that feed into enterprise scale systems. Furthermore, Mosaic machine learning consultants work closely with in-house meteorologists to ensure that the right data is deployed for each use case, and to help interpret and combine weather information from different models and data streams.
Weather Related Service Outages
Weather has large effects on how we can communicate with each other. A global network communications corporation involved in manufacturing satellites and monitoring signal quality for several telecommunications providers came to Mosaic to predict signal degradation due to weather. Any interruption reflected poorly on the firm. Specifically, our client’s customers were experiencing service interruptions due to rain or snowstorms.
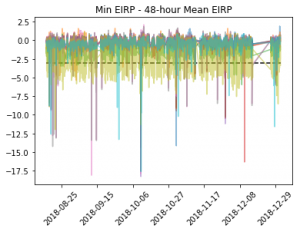
Mosaic’s client provided six months of satellite signal measurements for ten signals broadcast from locations across the United States. The client also provided geographic coordinates for the broadcasting stations. Mosaic then classified the signal strength based on a decrease of more than a certain amount from its recent average value. By classifying signal degradation in this way, Mosaic was able to avoid controlling for seasonal variations in signal strength due to temperature, making the project possible with just six months of historical data. Figure 3 shows the adjusted signal averages, with a dotted line showing the threshold at which customers would notice service interruptions.
Mosaic extracted historical weather forecasts based on the geographic coordinates of the broadcasting and monitoring stations for each of the ten signals. Mosaic’s ML development consultants compiled historical weather forecasts for the relevant locations from two data sources published by the National Oceanic and Atmospheric Administration (NOAA): the High-Resolution Rapid Refresh (HRRR) source and the Localized Aviation MOS Program (LAMP) data.
After merging the signal quality data with the relevant weather forecasts at intervals prior to each signal’s measurement, Mosaic’s consultants were ready to create machine learning models to predict signal loss based on forecasted precipitation. The client initially believed that the data would show a simple linear relationship whereby a higher predicted intensity of rain would be associated with a lower signal measurement. Exploratory data analysis showed that the relationships were much more complex – some signals had strong observable drops corresponding to forecast rain, others showed little to no effect even after severe snowstorms. After trying several machine learning algorithms on a subset of the data, the team found that gradient boosting machine (GBM) algorithms yielded consistently strong performance.
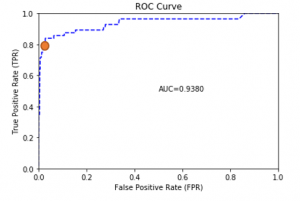
The results were promising; for most signals, the predictive models were able to identify a large percentage of true signal interruptions without an abundance of false alarms. For example, Figure 4 shows the ROC curve (which reflects the trade-off between true positives and false positives) for one signal. The red dot on the curve shows a threshold at which, if used to alert customers, would have accurately alerted them to 80% of service interruptions with a low rate of unnecessary alerts.
Furthermore, the engagement showed that it was possible to predict disruptions many hours in advance, giving customers enough time to act on the information. The global network communications firm will be able to integrate this model into an advanced warning system that alerts customers to impending signal interference. By providing notice ahead of weather-driven service disruptions, customers will be able to plan ahead, thereby mitigating the effects of unexpected outages.
Weather Related Workforce Scheduling
Optimizing seasonal staffing and resourcing is a key challenge for many industries, especially when the exact timing of high-volume activity can change based on complex factors. Augmenting the workforce too early means diverting profit to unnecessary personnel costs, while waiting until high-volume demand is already underway risks operating below capacity and decreasing customer satisfaction (e.g., if there are long wait times).
Machine Learning can be deployed to forecast seasonal demand, helping firms to anticipate periods with increased staffing needs. Whether daily, weekly, or monthly forecasting is required, advanced analytics and machine learning can drive operational efficiency through better resource allocation.
Many power generation and transmission companies face the challenge of determining what staffing levels they need to meet their customers’ winter heating demand. This is especially important for utilities operating in colder climates. While customers pay less attention to their heating service in the warmer months, when the cold hits, heating becomes critical and service requests begin to pile up. This can leave many companies caught off-guard, without the staffing and other resources ready to meet customers’ needs.
A utility operator in a chilly climate came to Mosaic with a request to build a machine learning model that predicts when customers will reactivate or service their heating systems. Reactivation and service events involve technicians visiting residential homes, putting a significant drain on dispatch resources and workload planning. events generally correlate with weather, but there is still quite a bit of variability that makes it hard to pinpoint based on weather alone. Other factors contribute to this timing, in perhaps non-linear ways, and machine learning is an effective way to map these complex relationships.
The utility was particularly interested in identifying the factors that influence heating reactivation request volumes and quantifying the underlying seasonal patterns driving macro-level changes over time. To address these questions, Mosaic data scientists first used data visualization techniques (e.g., Figure 3) to get a sense of relationships between dependent and independent variables to draw out seemingly obvious hypotheses, and to uncover hidden relationships in the data.
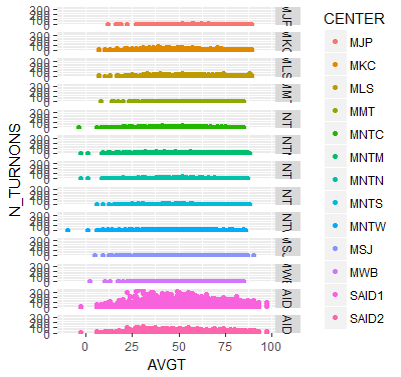
For example, Figure 5, which shows the temperature in degrees Fahrenheit along the x-axis, and the number of reactivation requests in a particular region on the y-axis, clearly shows that temperature has a location-specific effect on reactivation. The two distributions towards the bottom of the figure show larger numbers of turn-on requests at lower temperatures. In contrast, some of the other locations show constant request rates across a range of temperatures, suggesting a more consistent demand.
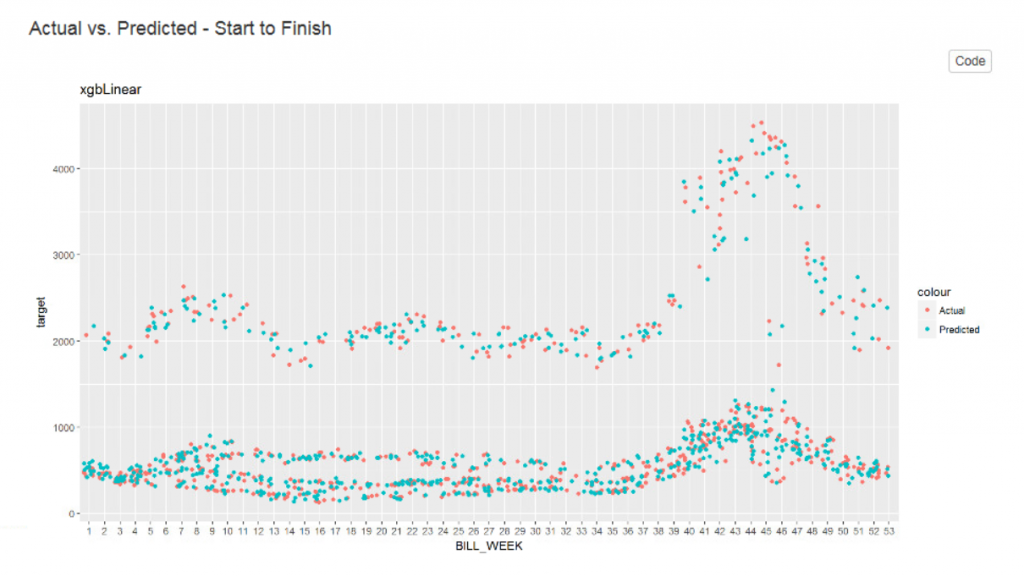
To find the highest-performing model among these combinations, the data science consulting team automated the workflow including hyperparameter tuning, model training and saving, and reporting in order to reduce the manual workload. The machine learning algorithms investigated included linear regression, random forest, single layer neural network, and XGBoost. The predictive power of these algorithms was tested within different time horizons (intervals of between 2 and 30 days) and in 13 geographic regions. While each learner showed promise, XGBoost tended to outperform in accuracy, as shown in Figure6, and was ultimately selected as the model to use in production.
Mosaic’s workforce planning prediction machine learning model allows the utility to proactively plan for heat reactivation events well before a spike in demand, allowing the company to manage its workforce to meet customer expectations and keep houses warm in the winter.
Conclusion
Measuring & quantifying weather-related effects efficiently & effectively is achievable. In conjunction with machine learning, these are very powerful tools that will make or save money for any business. Mosaic’s machine learning consultants are adept at leveraging multiple weather data sources to enhance any software system. Across industries, Mosaic can help business and technology professionals save time and make better decisions by incorporating multiple data sources, including weather data, into planning applications.
For More Information
Want to learn more? Please contact info@mosaicdatascience.com


