Summary
Our whitepaper discusses how data scientists can expand traditional hypothesis testing.
Take Our Content to Go
Moving Beyond Sampling & T-Testing
A hypothesis is a tentative, testable answer to a question. In order to make this scientific, one must be able to test this question. It is an important tool for any business, testing different theories and practices, and the implications they have for how you can improve your business moving forward. Hypothesis testing keeps executives from wasting time on initiatives that have little or no effect on growing the business. Answering these questions allows executives to maximize resources and workforce by focusing them toward measures that can produce the biggest effects.
The full scope of statistical hypothesis testing will not be examined in this white paper, but it is the foundation of inferential statistics, predictive modeling, machine learning development, and any artificial intelligence application. Read more about the foundations of statistical hypothesis testing here.
A business might be interested in diagnosing why a certain product performs better than another, while another business might be interested in why one piece of their supply chain is more efficient than others. In the days of limited data & compute power, traditional statistical sampling & experimentation techniques were employed, and statisticians were able to infer certain insights of the overall population. While this is still a foundational aspect of any analytical experiment, the explosion of data in recent years, increases in computing power and the rise of open-source machine learning algorithms, businesses are able to move beyond the t-test and begin to draw out insights in creative new ways.
Machines can be relied on more than humans to accurately identify patterns, correlations, anomalies, and trends, trained to react to what they see and automate a traditionally time-consuming process. Human analysts and decision makers can then focus on what they do best: interpreting the identified patterns and determining the best course of action in response. We aren’t saying to scrap traditional hypothesis testing – they are still quite powerful and used extensively at Mosaic – but adding other tools to the toolbox, only makes analytics more powerful. The only limits to applying creative data science techniques lie within our ability to think of problems for them to solve.
Data Science & Hypothesis Diagnostics
With the recent explosion of data and decrease in storage & computing costs, all businesses have a tremendous opportunity to collect, aggregate, analyze, and optimize against almost any business question an executive can dream up. If a decision maker is only relying on their ‘gut’, they are not only behind the times, but at high risk of losing competitive advantage, customers and market share.
So why does Gartner and other research firms still say almost 85% of companies are ‘immature’ when it comes to data analytics?
A major contributor is the hype & misinformation around AI, machine learning, and predictive analytics. These data science techniques are scientific approaches used to extract insight from data. There are underlying mathematical principles that allow practitioners to infer (predict) trends about large populations, but these need to be rigorously followed in order to achieve actionable results.
It certainly doesn’t help that many vendors & software providers claim to be ML-AI experts, or to have a pre-baked fully artificially intelligent system. Building a usable prediction or prescription model is a very individualized process to the data, domain, algorithm selection, and human factors. Human interpretability and usability are some of the most important aspects of deploying data science, and sometimes a model needs to sacrifice accuracy in order to be used. The sheer number of variables that go into true machine learning or AI project are vast, and no plug-and-play system is going to take you even 40% of the way to an accurate, efficient & effective solution.
In the following white paper Mosaic is going to examine three examples from projects we managed where we took a business question (hypothesis) and either proved or disproved the ‘gut feeling.’ For a leading gas station operator, we tested discount programs. In the consumer products world, we tested whether wholesaler sales volume impacted independent store sales volume. Finally, in the e-tail space, we examined how the lack of product availability influenced immediate purchasing decisions.
Spoiler alert – not only was Mosaic able to utilize machine learning, inferential statistics and other data science techniques to prove or disprove these hypotheses, we delivered actionable insights along the way.
Gas Station Loyalty Program Discounting
Use Case Background
Our customer operates thousands of quick service convenience stores & gas stations across North America. The firm manages a loyalty program through a mobile app to drive brand loyalty with customers and to increase the volume of goods sold. Executives thought they could drive even more gasoline sales through further discounting to their members. They needed to measure if dropping the price per gallon drove more sales volume, validating their beliefs. Instead of relying on ‘tribal’ knowledge, the company reached out to Mosaic to take a data driven approach.
Experiment Design & Execution
In collaboration with our customer, Mosaic helped design, execute & measure a controlled experiment at just over 200 locations in a specific region for over 6 months. The goals of this test were to measure which promotion has the highest lift, measured both in terms of frequency and sales from loyalty customers. One of the promotions offered a flat per gallon discount every day and the other offered the same per gallon discount every day plus a much larger one-time discount when a customer reached a minimum monthly purchase threshold. In order to access these discounts, a consumer needed to download and sign up for an app-based loyalty program, and registered app users were randomly assigned to receive one of the two promotions.
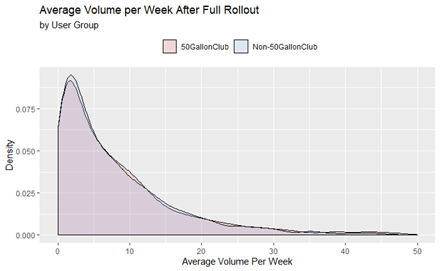
Unexpected Results
The pilot program and associated marketing efforts with discounting fuel sales substantially increased the app user base and participation in fuel promotions. The rate of new user signups more than quadrupled during the pilot, utilization of the per gallon promotion far exceeded legacy promotions and 20% more users engaged with the app on a weekly basis. The one-time quantity based discount did not show an increase in purchases, but did highlight some surprising insights. Not only did users interact with the app more, there was a slight reduction in time between consecutive transactions when the users had a one-time discount available to be redeemed. This test proved the gas station operator should continue its per gallon discount, expanding to other states, explore more targeted challenge-based promotions with an eye towards driving down time between transactions and leverage newly engaged app user base for A/B testing and personalized targeting.
Wholesaler Network Sales Volume Effects
Use Case Description
An enterprise specialty beverage producer & distributor had identified outliers in their sales volume from their independent store channel (Mom & Pop convenience stores). The CPG company believed that seasonal promotions to larger customers had a negative impact on sales to smaller, Mom & Pop customers because these customers were purchasing products directly from the Wholesale customers during these promotions. In order to maintain strategic relationships with these Big-Box retailers, the CPG firm needed to offer seasonal promotions and volume discounts.
Mosaic deployed a team of two data scientists to work through this hypothesis. The data scientists took a data-driven approach to estimating the impact of the Wholesaler promotional program on Independent sales volume. In conjunction with our customer’s SMEs, we were able to outline an analysis plan mapped to the questions executives wanted answered.
Advanced Analytics Modeling
Mosaic began the effort with an extensive exploratory data analysis with an eye towards getting a sense of the general health of the Independent market and identifying and visualizing big-box promotional effects. The project team decided to analyze sales trends and effectiveness of promotions within each channel and developed baselines with which to compare stores included in the experiment. This also controlled for factors that affected the volume, including week-to-week variation, overall trend, market changes, and seasonality.
The data science consulting team also ran algorithms identifying changes in the short- & long-run effects of promotions. Factors such as proximity of a Mom & Pop store to a Wholesaler & profitability were given more weight in measuring sales volume change.
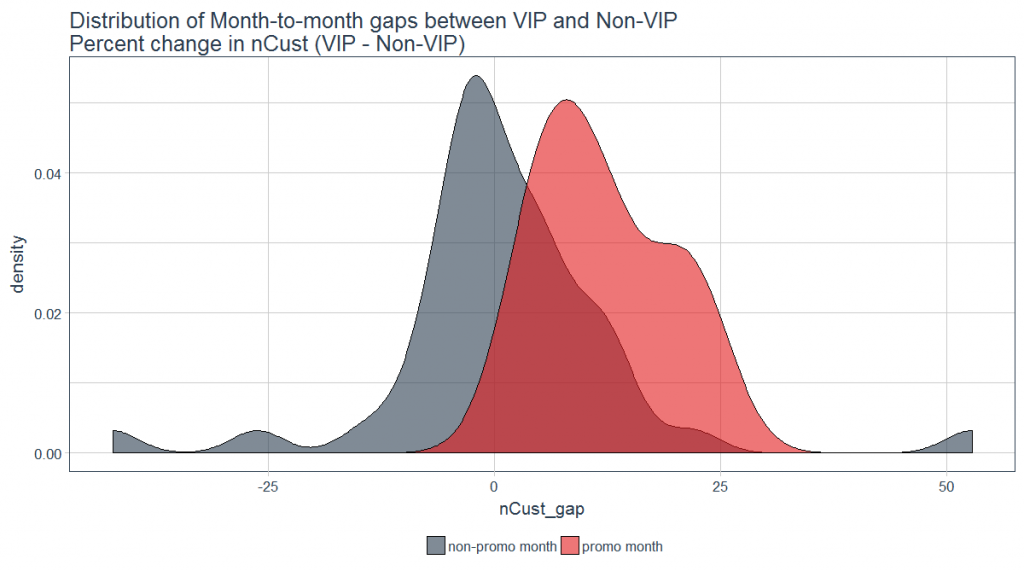
Surprising Results
Initially the strongly held belief was that the wholesale promotions were leading to lost revenue from Independent customers and that the discount program to Wholesalers should be either removed or scaled down in some way. The analysis uncovered some opposing conclusions. An analysis of the data showed that the Wholesales program should be continued, as the Wholesaler customers contributed an order of magnitude more to revenue than any losses from the Independent stores. The analysis also identified specific interventions that helped to protect Independent stores from any negative impacts. Without specific data-driven recommendations, and CPG advanced analytics, the firm could have implemented a misguided business strategy resulting in further cannibalized sales.
Product Availability Affecting Purchasing Behavior
Use Case Background
In the hyper-competitive world of e-tailing, traditional retailers need to shift their business model to analyzing digital consumer behavior, being proactive rather than adopting a reactive approach. A leading clothing manufacturer, distributor and retailer came to Mosaic with a major hypothesis they wanted to answer. Executives believed that online shoppers would stop shopping if they encountered an out-of-stock item, rather than continue to browse for related in-stock items. Further, they were curious if the effect differed when markdown items were specifically promoted on-site.
Earlier analysis had suggested that overall markdown promotions did have a positive effect on sales even of non-sale items. But executives pondered if the company was missing out on more potential purchases by moving inventory to markdown when the stock was too low?
Controlling the Experiment
Mosaic’s data scientists set up a test to analyze the behavior of shoppers when they encountered out-of-stock items. To do so, Mosaic traced shoppers’ activities through ~1.6M unique historical browse sessions. Some controls on the sessions were necessary, as people often engage with a retail website not to shop, but to look up store hours, read a blog post, or talk to customer service. Therefore, Mosaic focused on site visitors that viewed at least one product. Beyond the browse data, however, Mosaic also had to integrate product-level inventory over time to determine whether a viewed product was potentially out-of-stock at the time. It was also necessary to determine whether the viewed product was on markdown, and, if it was on special promotion at the time it was viewed. Once the definitions were established and the disparate datasets connected, Mosaic could begin to extract behavioral patterns.
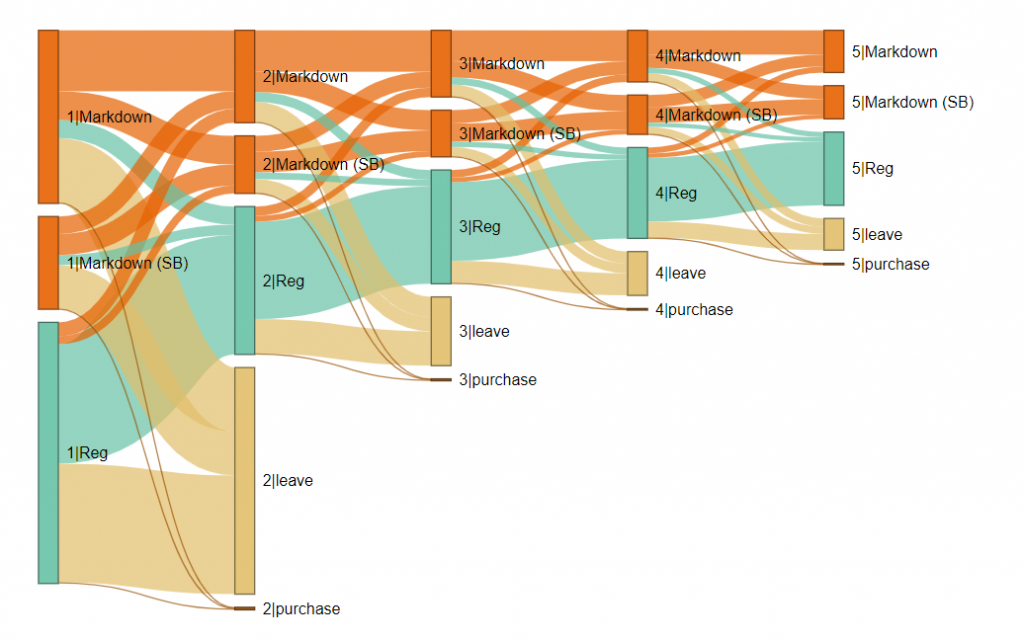
Confirmation!
It turned out that the executives’ hunch was correct. Shoppers whose first product view was of an out-of-stock item left the site at a higher rate than the other shoppers. This was true regardless of whether the item was promoted or not. This analysis led the executives to begin to consider new strategies for inventory management and markdown timing.
Conclusion
Executives have the ability to listen to their data to answer business questions. The ability to aggregate multiple data sources, apply traditional & non traditional analysis techniques and communicate insights should have all business operations employing a ‘data driven’ approach to answering questions. In each of the use cases above, data science was used to uncover insights in a matter of weeks, not years.
For More Information
Want to learn more about expanding hypothesis testing? Please contact info@mosaicdatascience.com


