Summary
Our AI consultants designed and deployed a custom tool to forecast store-level demand for a leading food & beverage manufacturer.
Take Our Content to Go
Background
A prominent soft drink manufacturer and distributor required assistance from a top analytics firm. The manufacturer owns and operates more than fifty brands, controlling six of the top ten non-cola soft drinks. Additionally, thirteen of its fourteen leading brands are number one or two in their flavor categories.
The company’s business intelligence and analytics team needed an order optimization capability that would support their account managers both in providing better service to customer accounts and in driving increased revenue from existing accounts. This desired capability would provide recommendations for upsell, cross-sell, and promotional orders to increase total product sales for each account. It would also automate the order process for mainline SKUs[1], enabling account managers to focus on value added activities during store visits.
Predicting store demand accurately is a major industry challenge. Mosaic Data Science, an advanced analytics consultancy, is uniquely positioned to tackle and create applicable solutions. Mosaic’s data scientists came at the problem in two phases: Phase One explored relevant issues, tested hypotheses, transformed and prepared the data for analysis, engaged in the business processes and technology, and experimented with various predictive analysis approaches. Using the information gathered in Phase One, Phase Two involved implementing and building the predictive model shown to produce the most superior results.
[1] “Stock keeping units” – unique products/packaging configurations manufactured by the company
Phase One: Analysis
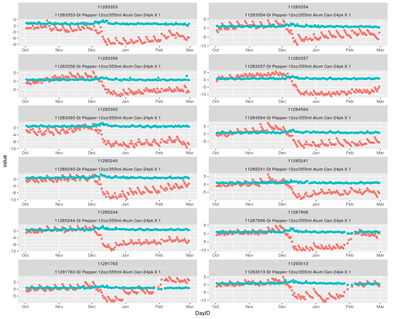
In collaboration with the soft drink company, Mosaic data science consultants developed a short-horizon predictive model that forecasts the case-quantity orders at a SKU-store level on the day of an account manager’s store visit. The model in Phase One became a proof of concept (PoC), enabling commitment and sponsorship from company executives. Corporate leaders need evidence that their data can be optimized in useful ways, and Mosaic’s model clearly provided that evidence. Predicted order quantities were compared against actual orders entered by account managers to demonstrate the precision of the model. Accuracy analyses were then distributed to business and IT stakeholders. Mosaic’s effective PoC model was capable of generating a predicted-order quantity for a subset of SKU-store combinations covering the SKU-stores with sufficient order history.
The model incorporated historical order data, store and SKU characteristics, account category (type of store), and other properties determined to be of use to the customer. It was trained on the historical data and applied to new data points representing an upcoming order opportunity. The model’s output was a daily prediction of the case-order quantities for each individual SKU at each store that an account manager would visit on that day.
Mosaic integrated and performed exploratory predictive analyses on three years of historical order data, store and SKU characteristics, account manager schedules, promotional data, and other sources. Mosaic’s AI consultants built an initial integration infrastructure to generate analyzable data sets from the different sources. Mosaic analyzed samples of integrated data to identify basic trends, correlations, and clusters of similarly performing customers/stores/SKUs.
Mosaic then focused on feature engineering and model development for the PoC predictive model. Mosaic generated modeling data sets with elements built from input data sources and evaluated and competed multiple models using cross-validation. Time series models, including ARIMA and ARIMAX, random forest regression, and simple linear regression were all evaluated. Our data scientists also performed model and feature selection and consulted extensively with the client team, ensuring that the model was performing optimally and effectively addressing the customer’s requirements.
Phase Two: Results
After testing different algorithmic approaches, Mosaic’s data scientists determined that three different models were required to appropriately account for the different order patterns observed in the data. A unique dynamic selection model was implemented to select the optimally performing of the three models based recent model performance for each individual SKU-store combination.
In the second phase of work, Mosaic developed an automated tool outputting predictions and performance metrics based on dates of training and testing datasets. This tool runs behind the predictive model developed in Phase One. The forecasts underlying the automation are at the day-location-SKU level, but are aggregated to groups of SKUs, groups of locations, and periods of time to permit improved decision making.
The following sections examine the different models used:
Day-of-Week Model
This model captures the case-quantity trend by day of week (DOW). For case quantities that are very regular (i.e., consistently the same or similar values) or follow a consistent weekly pattern, this model describes behavior well. A significant proportion of store-SKU combinations follow this behavior.
Store-SKU Regression Model
This model captures the behavior at the store-SKU level in a regression model using various features created from the historical case quantities. A separate regression model is implemented for each store-SKU combination, meaning that a dataset with 5000 store-SKU combinations will result in 5000 separate regression models.
The features included in the model are the case-quantity average per day of week, the case-quantity average for the previous 1 and 2 weeks, and indicator variables for each day of the week.
Normalized Store Regression Model
This model captures the behavior of case quantities at the store level that are common across SKUs at that store. There is a separate regression model for each store that is applied to each SKU at that store. Input and output values for each SKU are scaled based on overall order volume for that SKU to account for the wide variability in demand across SKUs at a single store.
The features included are the same as those in the Store-SKU regression model.
Dynamic Selection
This architecture combines the predictions of the above three models and selects the one performing best based on historical model performance. Because the three models complement each other in characterizing certain behavior of the case quantities, this model generally provides the most intelligent information and can adjust to pattern changes over time such as when a SKU moves from mainline to secondary status in a store or when a new account manager is assigned to a store. The model looks at the average forecast error for the previous 10 orders for each store-SKU, selecting the model that minimizes that error as the source of the next prediction for that store-SKU.
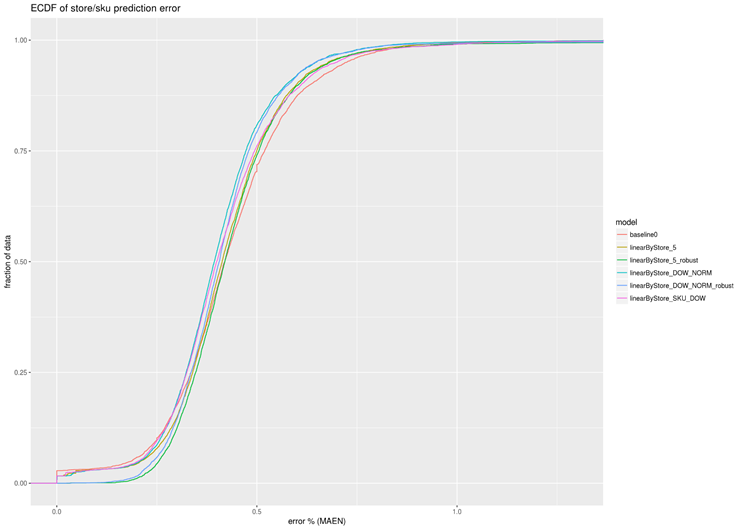
Summary performance metrics such as the MAEN (Mean Absolute Error, Normalized) and the MedianAEN (Median Absolute Error, Normalized) allow for the errors for different store-SKUs can be compared to one another on the same scale. Summary statistics for the errors are included at the daily and weekly level.
CPG Data Science Outcome
Mosaic Data Science’s prediction model and automated insights more accurately predict correct store orders, providing efficient and intelligent results. They optimize account managers’ time in the store, allowing them to direct their focus to upselling and promotions, not on matching up orders. By closely collaborating with our clients, Mosaic delivers valuable insight into business’s most pressing problems via CPG data science consulting.