Summary
This case study examines how Mosaic helped NASA and the FAA dynamically balance airspace capacity & demand.

Take Our Content to Go
Background
A primary goal of air-traffic management (ATM) is to balance airspace capacity and demand. Traditionally ATM has approached this problem assuming constant airspace configuration. A new ATM paradigm known as dynamic airspace configuration (DAC) analyzes how to reconfigure airspace dynamically in response to demand fluctuations, adverse weather, and the limitations of human cognition. DAC changes the airspace configuration to shift capacity where it is most needed.
DAC does not supersede risk-related ATM decision making. Rather, when there is a risk of adverse weather or route overloading, airspace-independent traffic flow management (TFM) decisions precede and constrain DAC decisions to manage risks appropriately. Regardless, airspace-dependent TFM decisions follow DAC decisions, to support equitable, optimal distribution of airspace capacity across air carriers, given the current airspace configuration.
Approach
Decision-support architecture. This case study describes development of a decision support system (DSS) that recommends DAC and TFM decisions in the presence of uncertain weather and demand patterns. The DSS’ architecture differs from other DAC models by acknowledging that decision makers (such as air traffic controllers) have a limited ability to evaluate alternatives in real time. The DSS therefore pre-computes a relatively small set of DAC decision templates. During ATM operations the decisions makers choose the template that best matches weather and demand forecasts. As time progresses the decision makers can make modest, incremental changes to a template, in response to actual weather and demand conditions. The DSS thus incorporates a three-step decision process:
- Prepare optimal DAC templates.
- Strategically select a template for the upcoming time period.
- Tactically adjust template parameters as conditions warrant.
The preparation model. The DSS incorporates several subsystems, each requiring its own data-science tools and techniques. For brevity we focus on the development of the subsystem that defines optimal airspace-configuration templates. This sectorization subsystem partitions weather and demand forecasts into equivalence classes. Each equivalence class has its own airspace configuration (routing and re-routing) template.
The project team employed several interesting data-science concepts and methods to cluster historical weather and demand scenarios. These included ensembles, sampling, stochastic optimization, and k-medoids clustering using the earth-mover distance (EMD) metric. The EMD metric defines a distance between two discrete probability distributions in terms of the amount of mass that must be shifted to transform one distribution into the other. Computing the metric requires solving a linear-programming problem, but the metric’s technical advantages make this worthwhile. Figure 1 illustrates the clustering process for EMD-based clustering of traffic patterns.

The amount of EMD computation for 4,950 scenario comparisons would take 10 days of execution time on available hardware. The team used a much simpler center-of-mass comparison to avoid computing the EMD distance between obviously dissimilar traffic patterns.
The clustering analysis led to selecting 10 clusters. Figure 2 presents two of the clusters’ mediods (central exemplars), by way of example:

Next, the team used a variant of the SectorFlow algorithm to optimize each traffic cluster’s sectorization. SectorFlow was developed under NASA contract from 2006 to 2010. Its objective function aggregates dynamic density and penalizes over-capacity conditions; see Figure 3:

SectorFlow uses NASA’s standard Welch capacity algorithm to compute sector capacity. Here are SectorFlow’s steps:
- Generate airspace demand profile based on user-preferred trajectories.
- Cluster sampled aircraft positions.
- Use computational-geometry techniques to form the initial boundary of the airspace that most efficiently encloses each cluster’s aircraft positions.
- Adjust sector boundaries heuristically to attempt to reduce the objective function.
- If no reduction is achieved, exit; otherwise, repeat step 4.
Figure 4 depicts this process:

The strategic model. Figure 5 depicts the DSS’ template-selection workflow.

One interesting challenge the team faced in implementing this workflow was standardizing convective weather forecast data from different kinds of forecasting products, including
- gridded probabilistic products,
- gridded deterministic products,
- area-based probabilistic products, and
- the National Convective Weather Detection (NCWD) product.
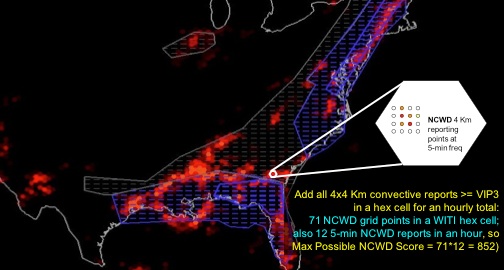
The DSS converts all of these into a quasi-NCWD representation that accounts for spatial and temporal variability, and that scales convective forecasts into maximum possible hourly NCWD scores for hexagonal cells. Figure 6 illustrates the result.
The tactical model. The DSS limits tactical airspace-configuration adjustments to modest boundary changes made in pre-defined increments called dynamic-airspace unit (DAU) slices. The hypothesis was that operational decision makers can manage DUA adjustments well, while they might struggle to respond correctly to dramatic operational changes to airspace configuration. We omit further details.
Results
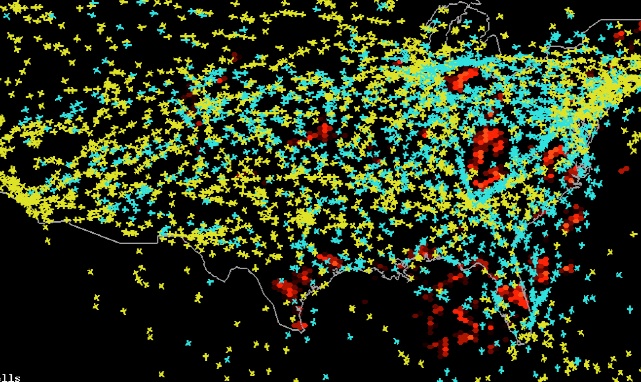
To test the DSS, the project team relied on the superfast-time DART traffic and weather simulation model developed for NASA and the FAA by Air Traffic Analysis Inc. in 2010. DART is remarkably efficient; it can run a highly realistic simulation of a full day of U.S. air traffic and weather on a desktop computer in two minutes. Figure 7 is a sample DART display. (Yellow flights are on normal routes; blue flights have been re-routed; adverse weather cells are red.)
The project produced many simulation results; here are some highlights. First, the decision templates reduced delay compared to baseline by an average of 58%, and by as much as 78%. See Figure 8.

Depending on the computational technique used for a certain step in the sectorization process, traffic performance improved as often as 86% of the traffic days studied. See Figure 9.

Most important, the project computed overall annual operational cost reductions over the entire national airspace for Airline Service Quality Performance (ASQP) carriers, using several methods. Figure 10 depicts savings by cluster, for each of 10 buckets of dates having similar traffic patterns.

This analysis estimated annual nationwide benefits ranging between 51 and 268 million dollars, depending on certain assumptions. These savings will increase if the analysis accounts for all national-airspace traffic, not just ASQP carriers.
For More Information
The foregoing glosses numerous technical details:
Mara Asencio et/al, “A Template Based Approach to Dynamic Airspace Configuration in the Presence of Uncertainties: Allocation Response to Weather Events (Final Report),” NASA Contract NNA11AC18C, 2013.