Summary
Mosaic built a model that predicted signal disruption, up to 16 hours in advance, based on North American precipitation forecasts and historical signal quality measurements.
Take Our Content to Go
Background
The weather has a substantial impact on many lines of business, including utilities, aviation and telecommunications. By ignoring market impacts due to weather, businesses risk costly service interruptions with long-term implications for customer retention. However, incorporating forecasts into operations can be tricky, due to the scale and complexity of atmospheric data, not to mention the geographic diversity of many modern businesses.
Mosaic Data Science has years of experience leveraging weather forecast data to improve operations across industries, and has staff meteorologists that provide subject matter expertise on this data. These assets led Mosaic to be the ML development partner of choice for a global network communications corporation involved in monitoring satellite signal quality for a number of telecommunications providers. Any interruption in communications reflected poorly on the networking firm.
Mosaic’s client was well aware of the effect of weather on its business but did not have an effective way to mitigate the impact on customer satisfaction. Specifically, our client’s customers were experiencing service interruptions due to rain or snowstorms. Because the affecting storm might be near the signal broadcasting station and not near the customer’s location, customers were unprepared for these outages. Mosaic built a model that predicted signal disruption, up to 16 hours in advance, based on North American precipitation forecasts and historical signal quality measurements.
ML Development
Mosaic’s data science consultants first integrated signal quality measurements with the historical weather forecasts. The dataset needed to contain information about what a satellite’s average and minimum signal strength was at a particular hour, and whether the weather forecast 16 hours prior to that signal measurement predicted rain.
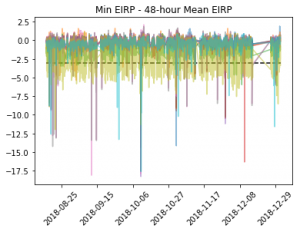
Mosaic’s client provided six months of satellite signal measurements for ten signals broadcast from locations across the United States. The client also provided geographic coordinates for the broadcasting stations and for the monitoring sites from which each signal was measured. Mosaic’s data scientists aggregated the signals, which were measured every five minutes, to hourly average and minimum values. In collaboration with the client, Mosaic then classified the signal strength based on a decrease of more than a certain amount from its recent average value. By classifying signal degradation in this way, Mosaic was able to avoid controlling for seasonal variations in signal strength due to temperature, making the project possible with just six months of historical data. Figure 1 shows the adjusted signal averages, with a dotted line showing the threshold at which customers would notice service interruptions.
Next, Mosaic extracted historical weather forecasts based on the geographic coordinates of the broadcasting and monitoring stations for each of the ten signals. Mosaic’s ML development consultants compiled historical weather forecasts for the relevant locations from two data sources published by the National Oceanic and Atmospheric Administration (NOAA): the High-Resolution Rapid Refresh (HRRR) source and the Localized Aviation MOS Program (LAMP) data. These sources are both updated hourly and are freely available to the public. However, archived data from these sources is loosely structured and spread across millions of separate text files. Mosaic created custom, reusable parsers to aggregate this data at scale and make it useable for analysis.
After merging the signal quality data with the relevant weather forecasts at intervals prior to each signal’s measurement, Mosaic’s consultants were ready to create machine learning models to predict signal loss based on forecasted precipitation. The client initially believed that the data would show a simple linear relationship whereby a higher predicted intensity of rain would be associated with a lower signal measurement. Exploratory data analysis showed that the relationships were much more complex – some signals had strong observable drops corresponding to forecast rain, others showed little to no effect even after severe snowstorms. After trying several machine learning algorithms on a subset of the data, the team found that gradient boosting machine (GBM) algorithms yielded consistently strong performance.
GBM algorithms are particularly well suited for this type of problem because they generate predictions by combining the results of many classification models. In practice, these models work well for problems where there are many features with weak correlations with the target variable, such as this problem, where the weather appeared to have inconsistent effects on the signal quality.
The results were promising; for most signals, the predictive models were able to identify a large percentage of true signal interruptions without an abundance of false alarms. For example, Figure 2 shows the ROC curve (which reflects the trade-off between true positives and false positives) for one signal. The red dot on the curve shows a threshold at which, if used to alert customers, would have accurately alerted them to 80% of service interruptions with a low rate of unnecessary alerts.
Furthermore, the engagement showed that it was possible to predict disruptions many hours in advance, giving customers enough time to act on the information.
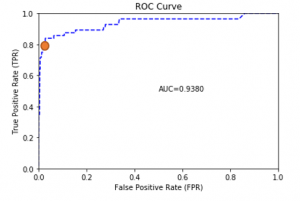
The ROC curve shows the tradeoff between accurately predicting the occurrence events of interest and falsely predicting events that do not occur, a tradeoff that exists to some extent in every machine learning classification model. This curve can be used to select an event detection threshold optimal to the current business problem. For example, the red dot on the curve shows a threshold at which nearly 80% of service interruptions would generate an advanced warning, and more than half of all warnings would be followed by an actual service loss.
Results
The global network communications firm will be able to integrate this model into an advanced warning system that alerts customers to impending signal interference. By providing notice ahead of weather-driven service disruptions, customers will be able to plan ahead, thereby mitigating the effects of unexpected outages. Although this global network communications provider is still unable to control the weather, the effect of weather on customer satisfaction will no longer be left to chance.
Mosaic can provide this sort of ML development for your business.