Summary
We designed and deployed predictive analytics to help doctors treat diabetes more efficiently and effectively long-term.
Take Our Content to Go
Background
One of the world’s leading healthcare information technology and innovation companies needed advanced analytics assistance in developing ‘flight path’ models to characterize the progression of patient health during the long-term course of diabetes disease management and treatment. The healthcare innovation company planned to use these models to identify effective disease management and treatment strategies in order to improve patient outcomes while controlling lifetime cost of treatment. The company had plenty of analytical talent, but lacked the advanced analytical talent Mosaic possessed to develop predictive disease progression models.
Mosaic, a top healthcare AI consulting company, was asked to help explore different ways to solve this problem analytically. The healthcare innovation company had some ideas on potential approaches, but wanted to get results from Mosaic to compare with their own modeling efforts. They understood Mosaic’s analytic professionals brought a wealth of modeling expertise from a number of different industries and experiences. Mosaic did it what it does best, glean insight from data.
Predictive Disease Progression Set-up
Mosaic, a leading machine learning company, provided data science consultants to work iteratively with the healthcare companies’ analytics team to glean insights from clinical patient data. Mosaic’s big data consultants’ explored three different experimental approaches. The first approach used clustering to identify patterns in the progression of health indicators. The second approach used a Markov/hidden Markov model to look at transitions between overall health states over the patient lifecycle. The final approach investigated regression-based predictive analytics.
Mosaic’s data scientists received two datasets, a clinical and an economic dataset to build a predictive model on. The clinical data contained approximately 800 variables representing the long-term medical histories of approximately 27,000 diabetics. The economic data contained an average monetary cost for each type of medical activity recorded in the clinical dataset.
Success criteria was determined to be based on successful diabetic outcomes (health criteria and biometric measurements) at minimal monetary cost. Being able to identify high risk diabetics before they are in immediate need of clinical help can save lives and improve care.
In setting up the modeling effort Mosaic determined there were six steps to be repeated several times in order to arrive at the best possible modeling approach.
- Data quality: The first step evaluated the quality of each source variable
- Variable definition: Much of the craft in building scientific models lies in defining a powerful set of predictors form the source data. The variable-definition exercise involved synthesizing new variables from the source variables, as well as setting aside source variables having low importance. Variable definition wound up culminating in formalizing the concept of an empirical diabetic flight path, and then reducing each patient’s medical history to a single empirical flight path of this form.
- Model selection: The overall model needed to have three components
- A formal empirical flight-path definition
- A function measuring the distance between two flight paths
- An unsupervised classification (clustering) algorithm
- Model execution: The model then needed to execute the clustering algorithm to reduce the patient base’s empirical flight paths to a small collection of sets highly similar flight paths
- Model evaluation and iteration: Each clustering algorithm should have its own measures of model quality. Mosaic’s data science consultants used these algorithm-specific measures to assess the quality of the flight-path classes produced by the algorithm and distance function.
- Model interpretability:
- Final model-quality measures
- Formal estimates relating flight-path attributes to outcomes
- Estimation of cost of clinical inaccuracies
- Estimation of the cost of misclassification by the final model
- Conclusions informing the design of a follow-on study attempting to optimize (prescribe) patient flight plans
Predictive Disease Progression Development
For this study it is important to understand the A1C test. The A1C test is a blood test that provides information about a person’s average levels of blood glucose, also called blood sugar, over the past 3 months. (US Department of Health and Human Services, 2014, p. 1)
Mosaic had four main tasks in their predictive analysis.
- Data collection, inspection and modeling
- A1C time history clustering
- A1C-state sequence modeling and analysis
- AIC outcome forecasting
The goal of trying these different modeling approaches was to select the most likely approach to meet the success criteria and provide recommendations on how to implement them.
Data Collection and Modeling
Mosaic took a quick pass through the data and set to prepare it for initial analysis within Matlab. Our data scientists then loaded the data into a database set up to allow the scientists to continue with additional processing and transformation in support of the flight plan analysis of health records.
A1C Time History Clusters
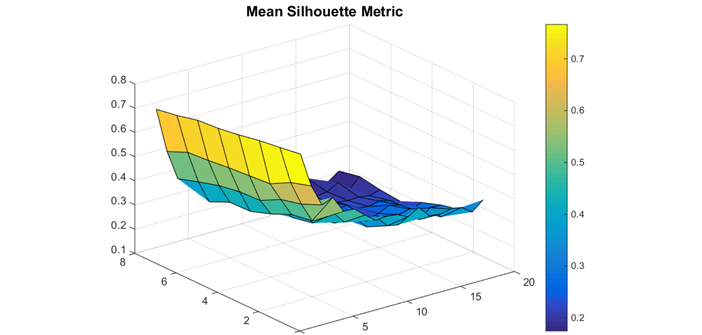
In this approach Mosaic used the A1C variables as the data to cluster. For each patient they created A1C time histories, or trajectories from 1-8 years in duration. After interpolating the A1C data, our scientists found for each patient a vector of A1C values. They then computed the distance between any two A1C trajectories as the Euclidean distance. Finally in this approach they used the K-means clustering method. While K-means is an efficient and accurate clustering method, it is not repeatable and the results varied slightly from run to run. These variations were minor and did not affect the conclusions.
The A1C trajectories produced meaningful clusters across the wide range of number of clusters and durations. The best clusters, according to the silhouette metric, resulted from using only two clusters over only a one year time span. In the image below an example of A1C clustering results is visualized.
This initial clustering analysis was useful in identifying a significant amount of A1C clustering cases to evaluate using the external validation measures. They can evaluate how meaningful the A1C trajectory clusters are by evaluating how well the clusters correlate with the other clinical and patient variables.
The clustering analysis helped to identify potential treatment controls or key indicators that should be incorporated into the overall model.
Markov Modeling
The Markov model sought to define flight paths based on transitions between well-defined discrete states governed by a set of transition probabilities. If a valid Markov model can be constructed from the data then the long-term objective would be to identify treatment controls that can influence transition probabilities. Effective treatment controls would increase the likelihood of patients transitioning to or remaining in healthier states. Mosaic’s data scientists developed and fitted an initial Markov model of diabetic flight paths.
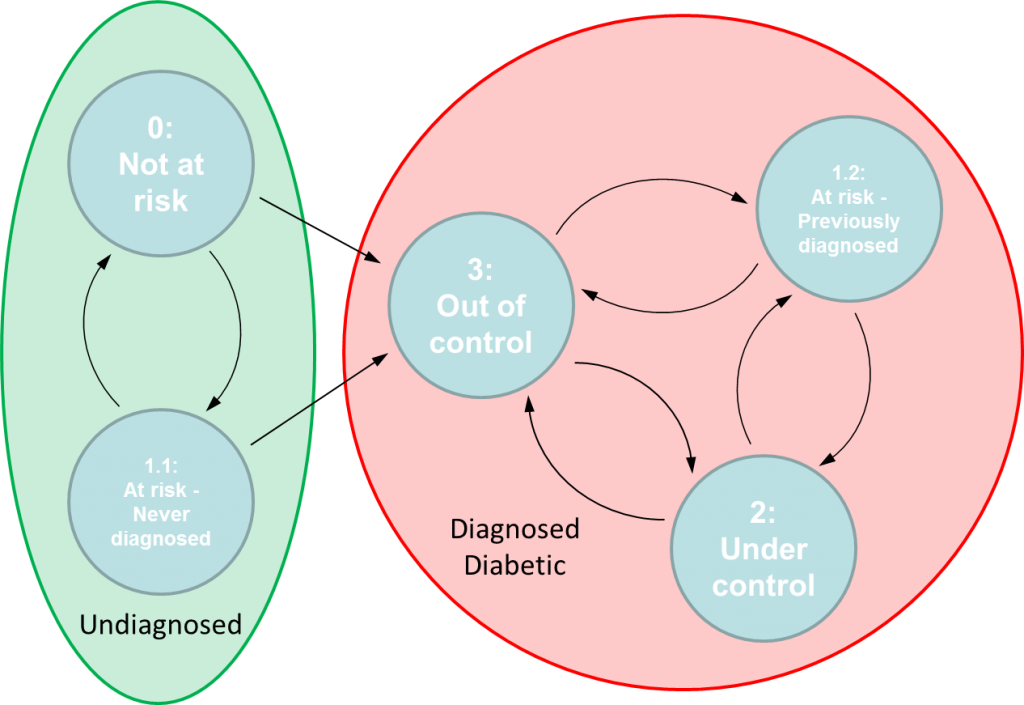
The Markov model was based on a four-state categorical assessment of overall patient conditions. The four states were; State 0: Not at Risk, State 1: At Risk, State 2: Diabetic – Under Control, and State 3: Diabetic – Out of Control. In working with a clinical subject matter expert, Mosaic developed the definitions of the clinical sates.
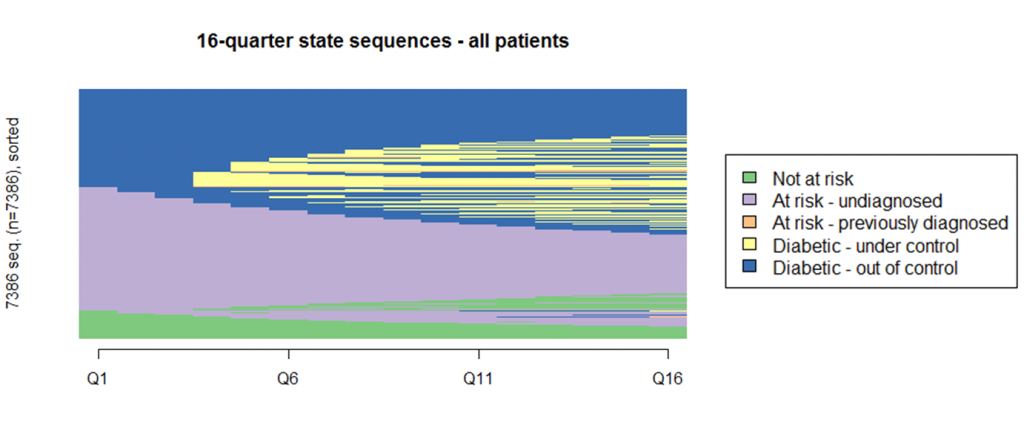
In the predictive analysis it became clear that many patients remain in a single state during the first four years of their patient records. In fact, the most frequently observed paths in the four-year data are “At Risk- undiagnosed”, “Diabetic-Out of control” and “Not at risk.” Together they make up almost half of all observed sequences. The results were the same when looking out over an eight-year time horizon.
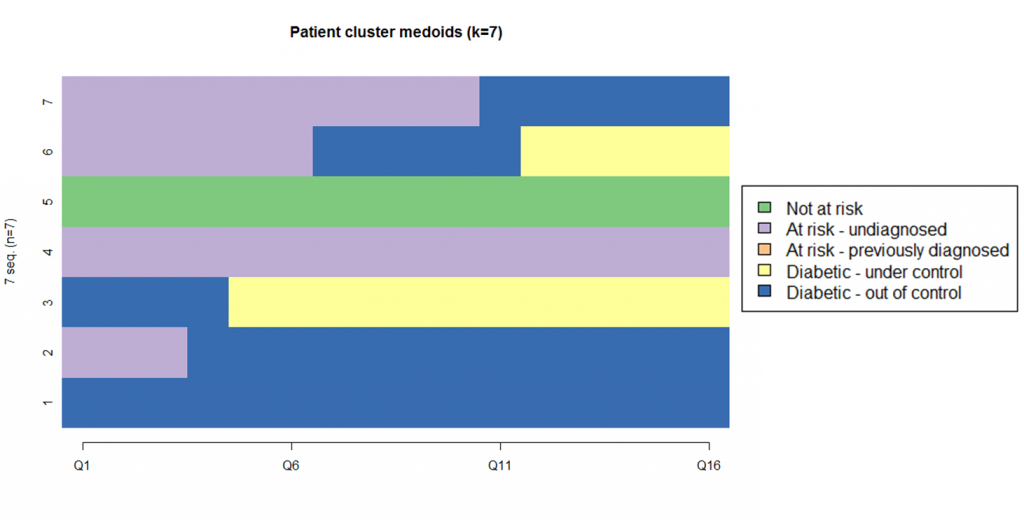
Our data scientists gained further insights by clustering the state sequences. The cluster analysis used k-medoids clustering based on a city-block distance metric. K-medoids is similar to k-means with the added constraint that the representative sequence for a cluster must be one of the clustering members. This prevents fractional cluster centers as would be found by a k-means clustering.
The clustering analysis showed that a state-based model formulation of patient flight plans can provide strong insights into different paths of patient health progression. The state model did not achieve the Markov property, but did point to mining the patient clusters to determine which additional variables may be of value. Understanding the variables that are correlated with patients following different clinical paths will help to determine how the state model may need to be modified to generate a Markov model.
Predictive Modeling
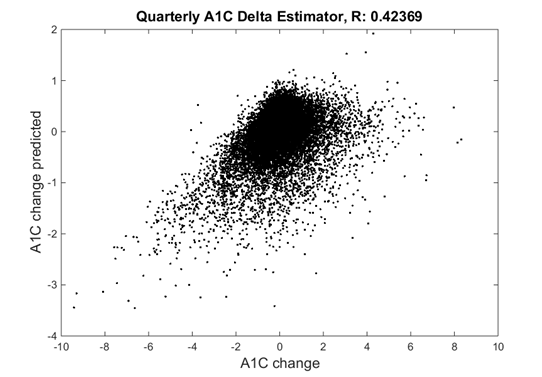
In this modeling approach, Mosaic examined a regression-based predictive analysis using clinical and patient variables to predict A1C change over a given time interval. Our data science consultants created an estimator that predicted the change in the A1C over a given time interval.
The AIC predictions were increasingly accurate as the estimator of time intervals grows. After running the predictive model it was decided that more clinical variables could be added such as patient payments, encounters, alcohol and tobacco use, to improve model results.
Results
Mosaic found promise in each of the three different predictive disease progression modeling approaches outlined above. Each approach, with further model tuning and increased variable understanding, would provide predictive insights on the diabetes patients. Improving prediction related to A1C would allow this healthcare innovation company to provide invaluable data-driven insights, giving medical professionals the decision support they need to save lives and improve the treatment of diabetes.